
People
Client Charts
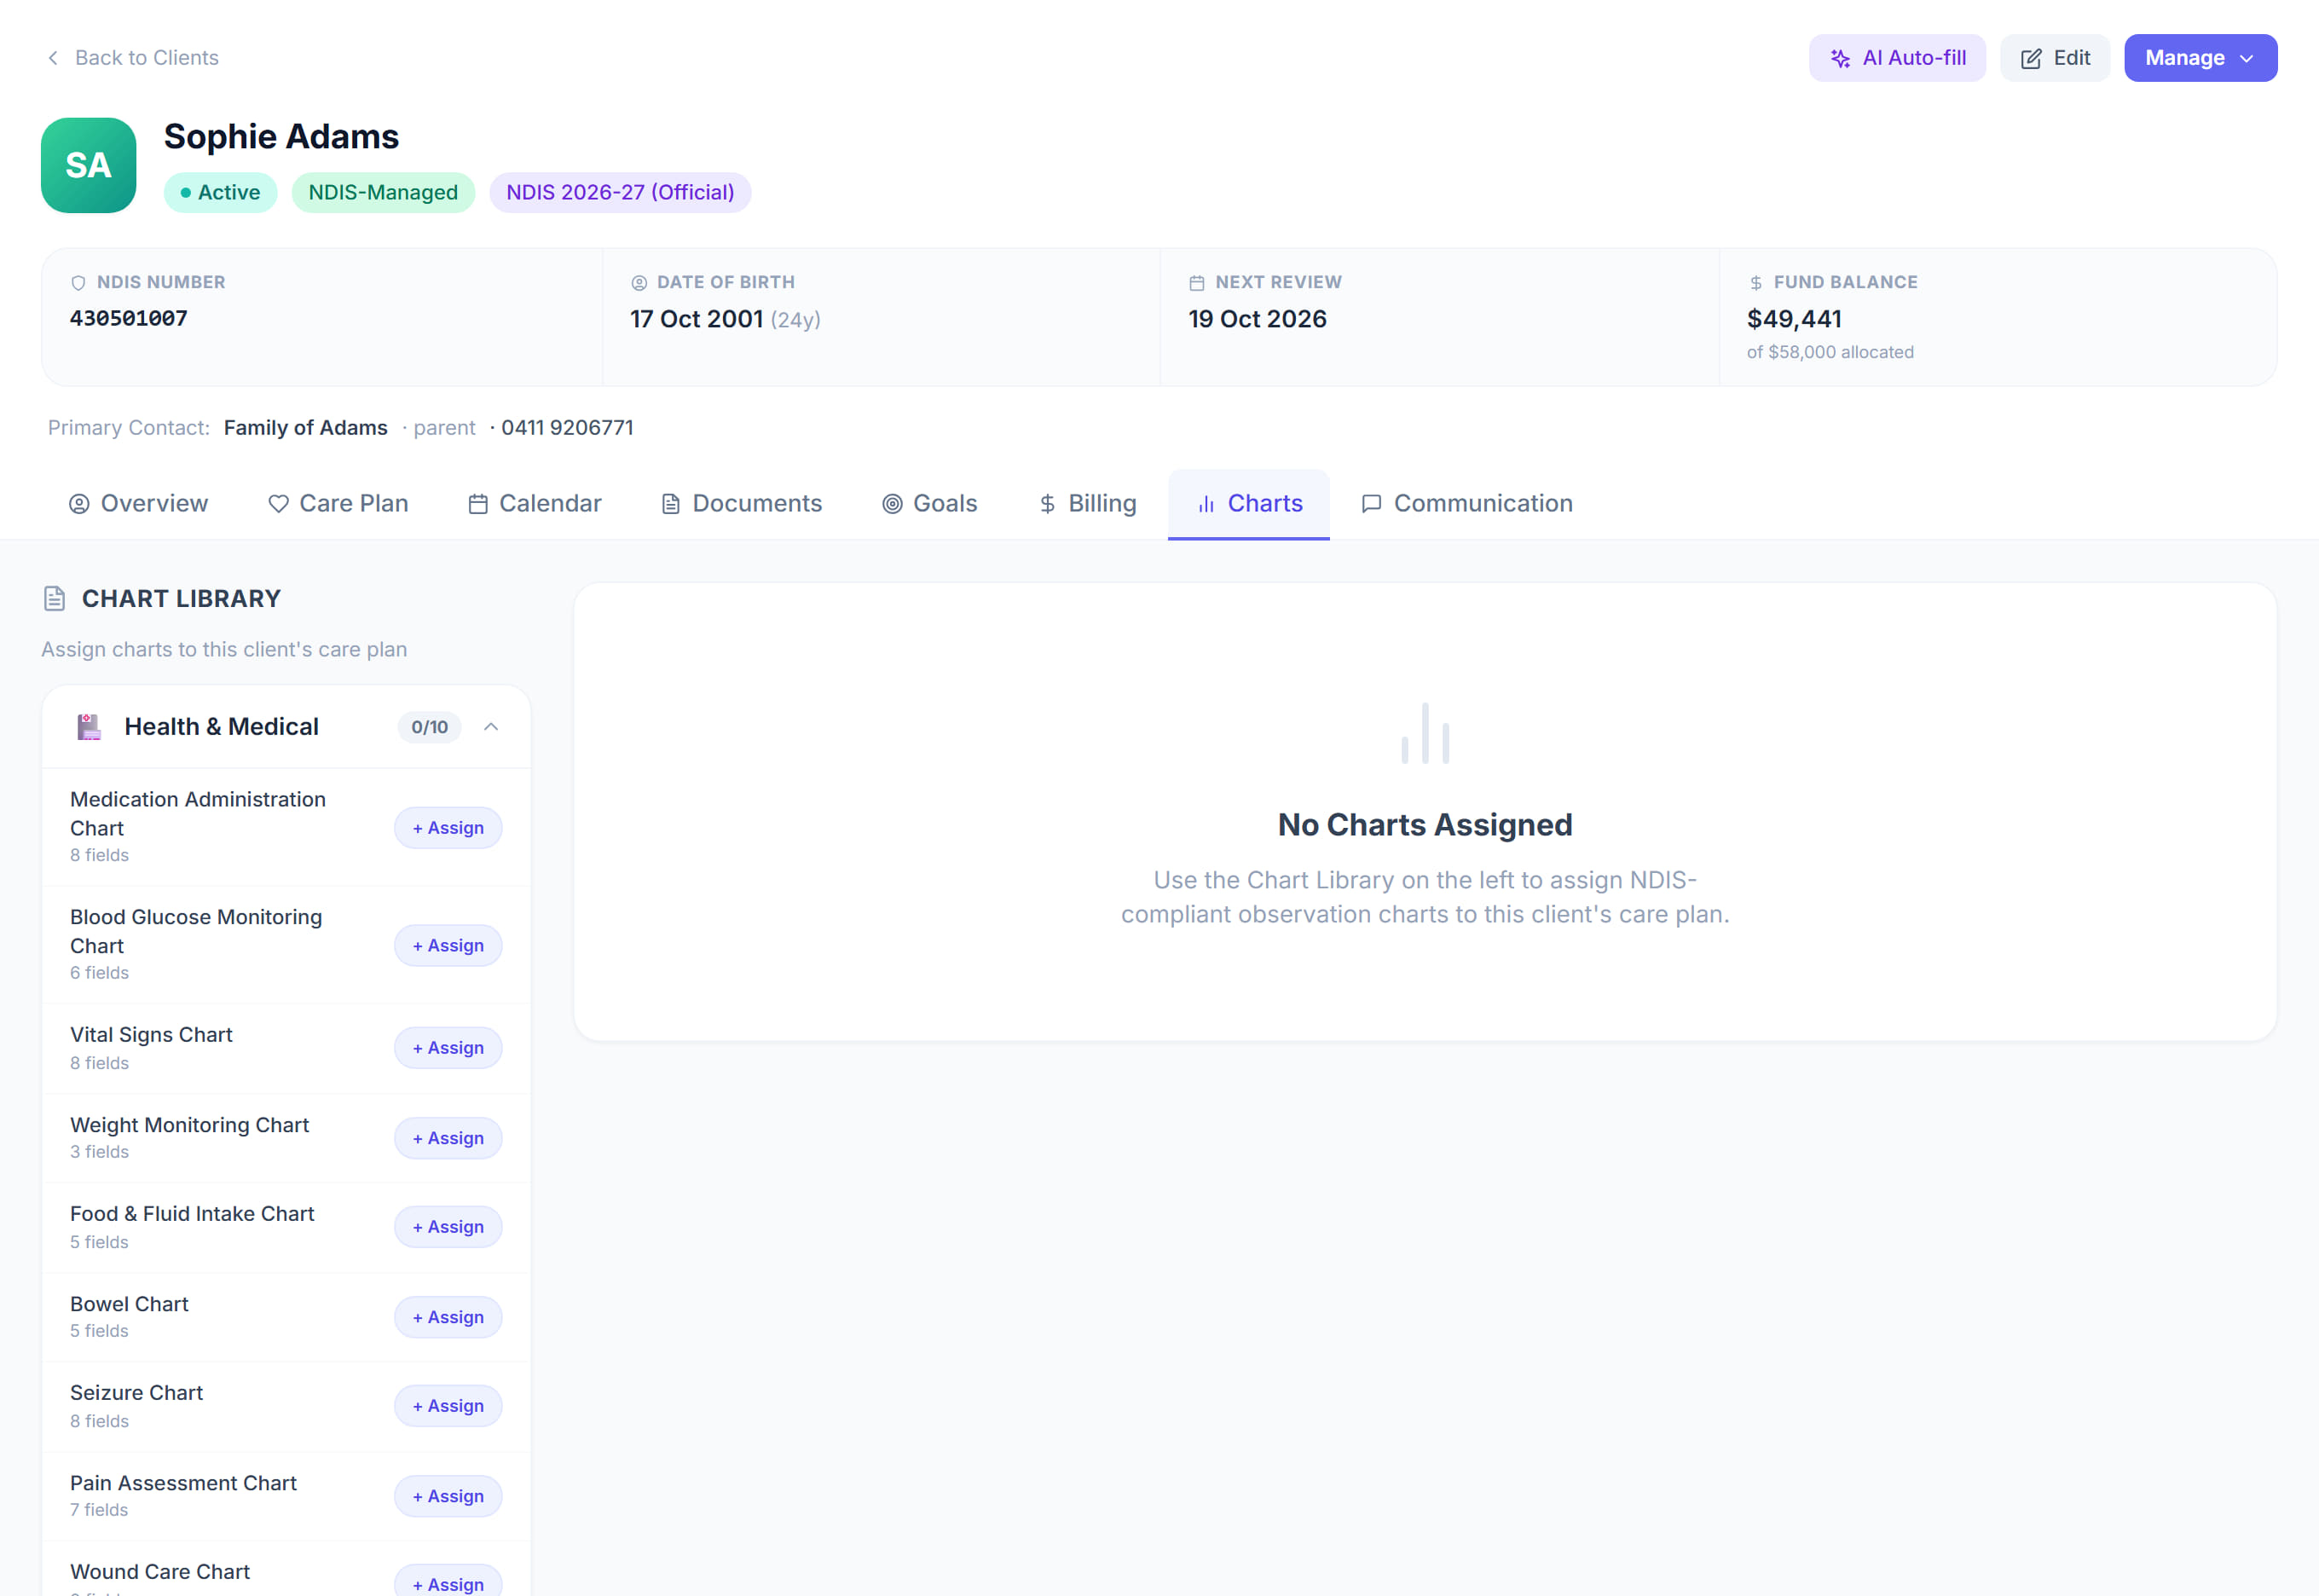
Client profile → Charts4 steps
The participant over time — hours delivered, spend against funding, and how the pattern is moving. It is the quickest way to see that somebody is burning through a category faster than the plan allows.
Step by step
- 1
Open the participant and click the Charts tab.

- 2
Read the spend against the funding period, not against the total. A plan two months in should be roughly two months spent.
- 3
Change the range to compare one period with another.
- 4
Anything climbing steeply is worth raising before the funding runs out, not after.
The screen
Did this answer your question?
If not, talk to us — we answer from Australia, in business hours.